

Seismic attenuation is defined as the reduction of seismic wave amplitudes during propagation through the Earth’s crust, a phenomenon that affects most aspects of seismology. The attenuation parameter represents how earthquake waves decay as they propagate away from the source, contains information about the redistribution of seismic energy within the crust, and contributes to the accuracy of earthquake hazard assessments for engineering purposes. The attenuation mechanisms can be expressed by frequency-dependent amplitude decay, quantified by the dimensionless quality factor Q. The quality factor Q, which represents the ratio of the total energy to the energy lost per oscillation cycle, was first introduced in material science and later adopted in seismology by Knopoff [1]. High Q values indicate a relatively elastic medium with minimum energy loss. In contrast, low Q values correspond to sudden amplitude decrease [2], typically observed in tectonically active or fractured high-seismicity crustal zones.
First, attenuation directly influences seismic hazard evaluation by affecting the amplitude and frequency content of earthquake ground motions. Hence, determination of accurate regional Q values is essential for developing reliable ground motion prediction equations [3]. Secondly, the precise determination of earthquake source parameters is critically dependent on the consideration of attenuation. Accurate determination of quality factor values is essential for minimizing errors in the estimation of spectral source parameters, including stress drop, seismic moment, and source radius [4]. Thirdly, seismic attenuation serves as a powerful diagnostic tool for understanding the physical state of the crust and upper mantle [5]. This utility is because the quality factor (Q) is highly sensitive to variations in rock composition, fluid content, fracturing, and temperature. As a result, anomalously low Q values are typically interpreted as signatures of high heat flow, active tectonism, and volcanic regions. Conversely, high Q values are characteristic of cold, competent, and geologically stable lithosphere [6].
The regional Q value can be calculated using the different seismic wave phases (P, S, Lg, and Koda) observed in seismograms [7, 8, 9, 10]. Therefore, the obtained Q value is named together with the phase used (Qp, Qs, QLg, Qc). Body waves represent the field along the path between the source and the station. In contrast, coda waves are considered as scattered seismic waves resulting from the interaction between regional heterogeneities and body waves [11] and containing information about the deeper parts of the lithosphere. In other words, Qp and Qs, determined directly using body waves, address the absorption characteristics in the shallow crust, while Qc contains information from deeper environments.
The coda normalization method (CNM), introduced by Aki [12], enables the estimation of the S-wave quality factor (Qs) by normalizing direct S-wave amplitudes to those of coda waves from a single earthquake recorded by a regional seismic network. Furthermore, the method can be readily applied to a dataset comprising multiple earthquakes recorded at a single station. Later, Yoshimoto et al. [7] observed that CNM also produced consistent results for direct P waves and updated the technique as the extended coda normalization method (ECNM). The method is based on the principle that the spectral amplitude ratios of direct P, S phases and coda windows show a significant decrease with increasing source-station distance. In seismology, recent developments in the propagation and amplitude properties of coda and body waves have led to the widespread use of ECNM in various tectonic environments worldwide. This has facilitated valuable comparisons of attenuation properties between different tectonic regimes worldwide. The method has been successfully employed in numerous regions, including: the Kanto area, Japan [7]; the Bhuj region of east-central Iran [10]; the Kinnaur Himalayas [5]; the Aswan Reservoir area, Egypt [13]; and the volcanic provinces of the Apennines, Italy, and Sonora, Mexico [14, 15]. In most of these studies, the CNM has been applied to high-frequency earthquake data (up to 63 Hz) recorded in volcanic regions or areas of high seismicity, with hypocentral distances typically not exceeding 160 km.
In Türkiye, the coda normalization method has been applied to various tectonic settings, which reflects the complex seismotectonic structure of Anatolia. Demirci, Demirci and Demirci et al. many studies have been performed by [16, 17, 18] focusing on the Büyük Menderes Graben, on southwestern Anatolia and along the eastern part of the North Anatolian Fault Zone. These investigations, based on local earthquake datasets within the frequency range of 1.5–18 Hz, provided valuable insights into attenuation characteristics across extensional and strike-slip environments. Ak\(\mathrm{\imath}\)nc\(\mathrm{\imath}\) et al. [19] applied the CNM in Eastern Anatolia, particularly in the Erzincan region, using local seismic events in the 1.5–24 Hz frequency range. In the Marmara region, Horasan and Boztepe-Güney [20] carried out multiple studies, examining earthquake records from both the Sea of Marmara and surrounding areas, and calculated Q functions for five subregions. These studies show that CNM has been successfully applied in different parts of Türkiye, covering extensional, strike-slip, and convergent tectonic domains, and underline the importance of regional analyses for understanding seismic attenuation.
The seismic attenuation structure of the Biga Peninsula, a critical factor for accurate ground motion prediction, remains poorly constrained and represents a significant gap in the regional seismological characterization. While earlier studies have provided valuable insights into the region’s seismotectonics, historical seismicity, and paleoseismology, the attenuation characteristics have been largely overlooked. Closing this knowledge gap is essential for advancing seismic hazard assessments in the Çanakkale region, where densely populated areas, invaluable historical sites, and critical infrastructures are exposed to significant earthquake risks. This study directly addresses this gap through the analysis of 1714 local earthquakes recorded between 2010 and 2019 at 12 stations operated by the Kandilli Observatory and Earthquake Research Institute (KOERI) [21]. We employ the Coda Normalization Method (CNM) to estimate frequency-dependent Qp and Qs values for three seismogenic zones in the Biga Peninsula. The resulting frequency-dependent functions will clarify the influence of faulting style, crustal complexity, and lithological variation on attenuation. Ultimately, these findings are expected to provide critical inputs for future seismological assessments and contribute to the fundamental scientific understanding of the regional seismotectonics.
The Biga Peninsula lies north of the westward tectonic escape of the Anatolian Block and the Western Anatolian extension resulting from the collision of the African and Eurasian plates. (Figure 1a) The complex tectonic structure in the region has been shaped on this dynamic foundation [22, 23]. The North Anatolian Fault Zone (NAFZ) is the primary tectonic feature responsible for the faulting patterns observed on the peninsula. This approximately 1200 km-long, right-lateral strike-slip fault system, which extends westward across Northern Anatolia parallel to the Black Sea, divides into two main branches, northern and southern, upon reaching the Sea of Marmara.
The northern branch, the Ganos Fault Zone, extends along the Gulf of Saros, forming the northern tectonic boundary of the Biga Peninsula (Figure 1b1). The GFZ, comprised of numerous sub-segments with a predominantly right-lateral strike-slip character, caused the 1912 Mürefte-Şarköy earthquake (M=7.2) and remains seismically active today [24]. The Ganos Fault Zone exhibits prominent linear fault traces and intense seismicity, potentially affecting the peninsula and, due to its location, the entire Marmara Region.
The southern branch consists of the Yenice-Gönen and/or Çan-Biga Fault Zones (Figure 1b2), trending NE-SW and passing south of the peninsula. This fault zone triggered one of the most destructive earthquakes in Western Anatolia, including the 1953 Yenice-Gönen earthquake (M=7.2). This fault zone has a multi-segmented structure consisting of strike-slip fault clusters along with secondary faults. These faults directly influence seismic wave propagation by influencing crustal heterogeneity [25].
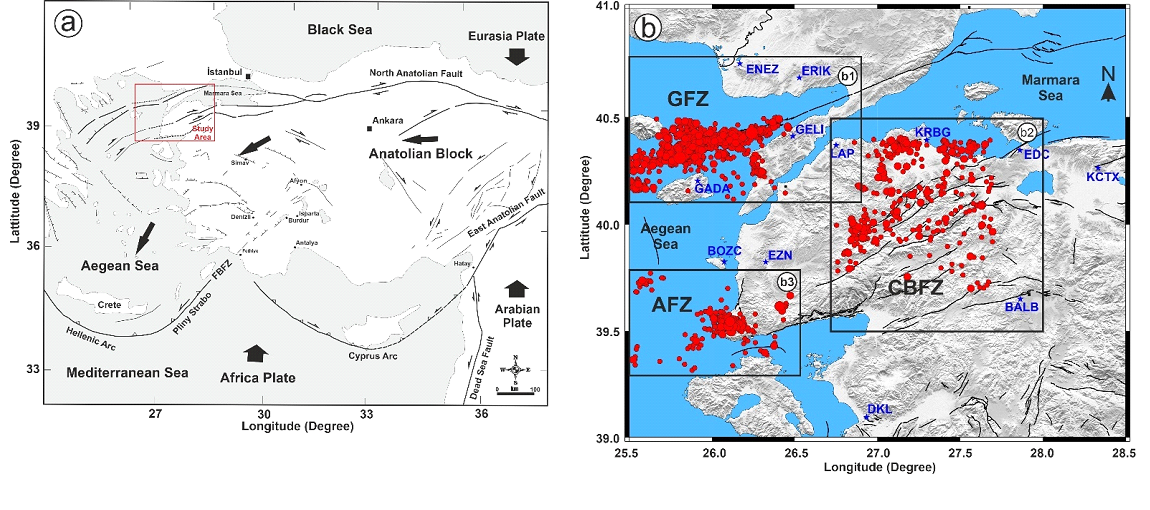
In the southwest of the peninsula, the tectonic regime becomes extensional. The Ayvac\(\mathrm{\imath}\)k Fault Zone within this region consists of stepped normal faults trending NE-SW and NW-SE (Figure 1b3). The 2017 Ayvac\(\mathrm{\imath}\)k earthquake, which exhibited long-lasting aftershocks and caused numerous earthquakes, is associated with this extensional system. The intense geothermal activity, hot springs, and hydrothermal alteration zones in the region indicate high fluid pressure and temperature in this part of the crust [26]. This plays a decisive role in the region’s weak crustal structure and the attenuation characteristics of seismic waves.
A complex mixture of metamorphic core complexes, ophiolitic melanges, Neogene sedimentary basins, and widespread Cenozoic volcanism characterises the geology of the Biga Peninsula. All these units are cut by active strike-slip and normal faults of the North Anatolian Fault Zone and the Aegean extension. This diversity creates a crustal structure that shows high variability in terms of rock types, mechanical properties and fluid content, which directly affects seismic attenuation. Fragmented structures, such as ophiolitic melanges, promote scattering of seismic energy, while sedimentary basins facilitate anelastic absorption due to their pore water content. Furthermore, young volcanic rocks and high heat flux lead to enhanced anelastic attenuation [14]. Understanding this geological-tectonic setting is of vital importance for the interpretation of the frequency-dependent Q values obtained in this study, because the attenuation differences between the Ganos, Çan-Biga and Ayvac\(\mathrm{\imath}\)k fault zones can be associated with the unique geological and tectonic conditions of these units. This geological diversity is represented by three main units (metamorphic, sedimentary, and volcanic) that are distributed in distinct zones as a result of the region’s complex evolution (Figure 2).
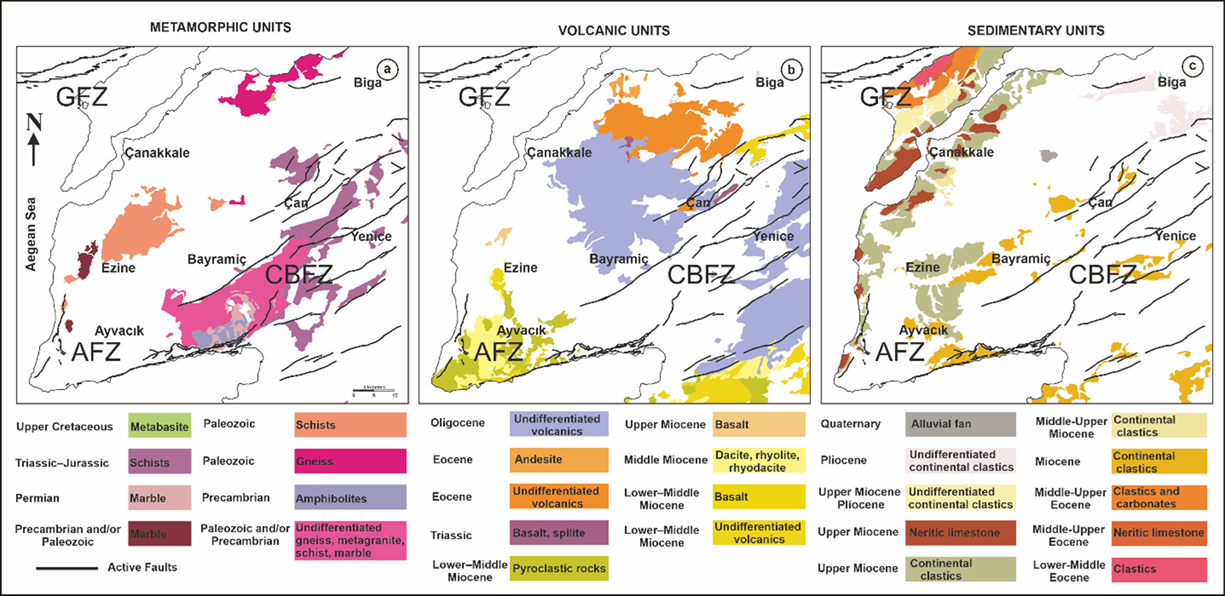
The metamorphic units, which constitute the basement rocks of the peninsula, are particularly prominent within the bands extending along the Çan-Biga and Yenice-Gönen Fault Zones. In the vicinity of the Ayvac\(\mathrm{\imath}\)k Fault Zone, the oldest units, comprised of Paleozoic gneiss, schist, and marble, are prominently exposed. These are overlain by sequences of Precambrian amphibolites and Permian marbles. The entire metamorphic basement is capped by Triassic-Jurassic schists. The spatial distribution of these units, as illustrated in Figure 2a, highlights their close genetic and structural relationship with the major fault systems.
Overlying this metamorphic basement in the northwestern part of the Biga Peninsula, extensive areas are covered by Middle-Upper Miocene clastic and carbonate units, along with Upper Miocene-Pliocene terrestrial sediments. The deposition of these sequences was likely influenced by, and subsequently influences the morphology of, the Ganos Fault Zone. Along the western coastline, Upper Miocene terrestrial clastics and neritic (shallow marine) limestones constitute the predominant lithologies. The southward extent of these neritic limestone units is clearly delineated in the region, as shown in Figure 2b.
In addition to these sedimentary covers, the most prominent volcanic units are distributed around the Ayvac\(\mathrm{\imath}\)k and Çan-Biga Fault Zones, highlighting the strong tectonic control on magmatic activity. In contrast, the volcanic activity around the Çan-Biga Fault Zone is characterized by older, extensive Eocene and Oligocene volcanic suites (Figure 2c), Lower-Middle Miocene basalts form the foundation, which are successively overlain by Middle Miocene dacite, rhyolite, and rhyodacite flows. This intermediate to felsic volcanic sequence is, in turn, capped by a package of Lower-Middle Miocene pyroclastic rocks. In contrast, around the Çan-Biga Fault Zone, extensive areas of Eocene and Oligocene volcanic rocks are evident (Figure 2c).
To quantify the frequency-dependent seismic attenuation for both P and S waves, we employed the Coda Normalization Method (CNM) as formulated by Yoshimoto et al. [7]. The fundamental premise of this technique is that the spectral amplitude ratio of direct body waves to coda waves exhibits a systematic decay with increasing hypocentral distance, independent of source and site effects. By normalising the direct P- or S-wave amplitude to the coda wave amplitude, the influence of the source spectrum, instrumental response, and site amplification is naturally removed in the analysis. Aki [12] defined the spectral amplitude (Ac) of the coda phases observed on the seismogram after a length of more than two times the S-wave travel time as: \[\label{GrindEQ__1_} {{A}}_{{c}}\left({f,}{{t}}_{{c}}\right){=}{{S}}_{{s}}{P}\left({f,}{{t}}_{{c}}\right){G}\left({f}\right){I}\left({f}\right). \tag{1}\]
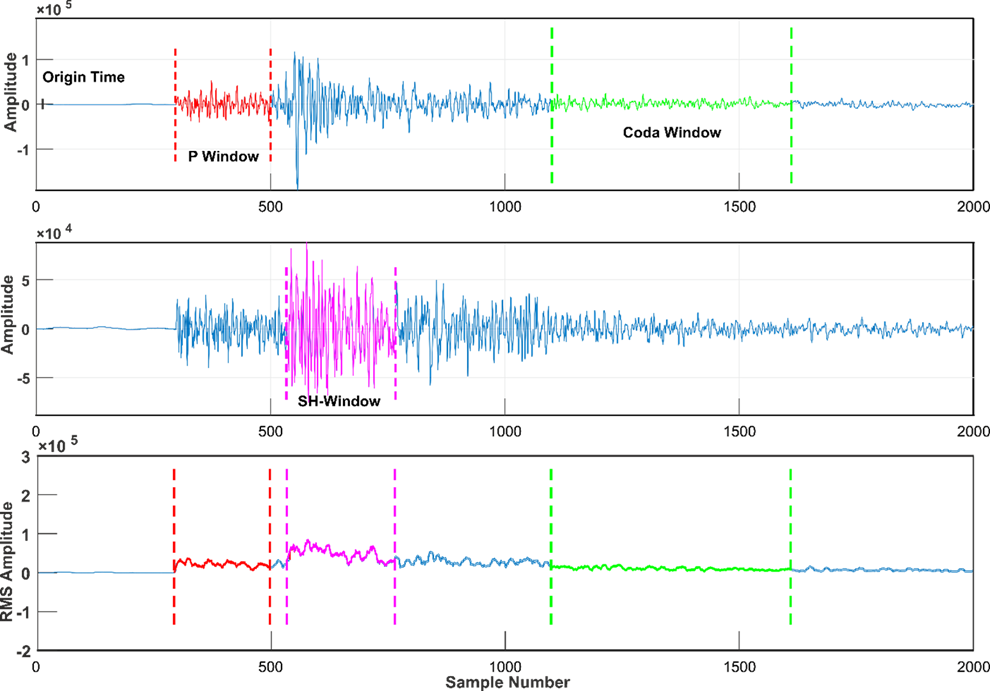
For the direct P and S phases, spectral amplitudes (Ap(f, r) and As(f, r)) were obtained from the peak-to-peak measurements within a 2.048-second window. The coda spectral amplitude (Ac(f, tc)) was calculated as the root-mean-square (RMS) amplitude on the horizontal component with 5-sec window lengths (Figure 3). Consistent with established practice (e.g. [29]), we confirmed through comparative analysis that results from a single horizontal component were statistically robust. the spectral amplitudes of the body waves undergoing the normalization procedure are shown as: \[\label{GrindEQ__2_} \frac{A_{s,p}(f)}{A_c(f,t_c)}=\frac{R_{\varphi}\varnothing S_{s,p} (f) r^{\gamma} e^{-\left(\frac{\pi f r}{Q_{s,p}(f) V_{s,p}}\right)}G(f) I(f)} {S_s P(f,t_c) G(f) I(f)}. \tag{2}\]
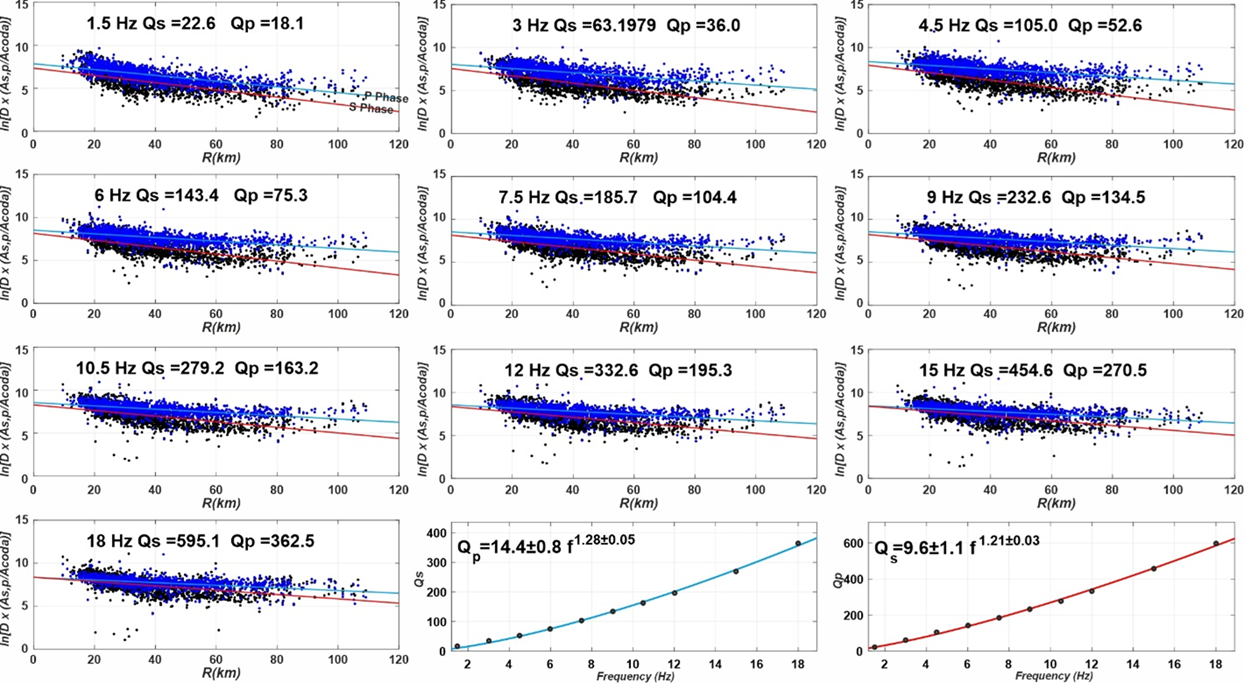
Consequently, the vertical component was used for Qp analysis and the East-West component for Qs analysis. The quality factors of Qp and Qs were derived from the relationship: \[\label{GrindEQ__3_} \ln\!\left\{ \frac{R_{\varphi}\,\phi^{-1}\,A_{s,p}(f,r)\,r^{\gamma}} {A_c(f,t_c)} \right\} = -\frac{\pi f r}{V_{s,p}\,Q_{s,p}(f)} +\mathrm{cnst}(f), \tag{3}\] where r is the hypocentral distance, V\(_{s,p\ }\)is the average crustal velocity for the respective wave type, \(\gamma\) is the geometrical spreading exponent, and cnst(f) is a frequency-dependent constant. The geometrical spreading term was modeled as r\(^{-1}\) for distances less than twice the Moho depth, estimated to be \(\mathrm{\sim}\)45 km for the region [30]. For larger distances, the form (r.h.m)\(^{-0.5\ }\)was adopted, in accordance with models for regional wave propagation [10]. For each central frequency expressed in Table 1, Qp(f) and Qs(f) were determined by performing a linear regression of the right-hand side of Eq. (1) against epicentral distance r. The slope b of the best-fit line is related to the quality factor by: \[\label{GrindEQ__4_} b=\frac{\pi f r}{V_{s,p}\,Q_{s,p}(f)}. \tag{4}\]
The frequency dependence of attenuation was then characterized by fitting the estimated Qp(f) and Qs(f) values to the power-law relation form of Q\(_{s,p}\)(f)=Q\(_{0}\).f\(^{n}\) , here Q\(_{0}\) represents the quality factor at 1 Hz and the exponent n describes its frequency dependence. Finally, we computed the average Qs/Qp ratio for each fault zone. This ratio is a crucial parameter for comparative tectonic studies, as it provides insights into the relative levels of crustal heterogeneity and fluid saturation across different seismogenic regions (e.g. [5]).
| fL [Hz] | fH [Hz] | fC [Hz] |
|---|---|---|
| 1.0 | 2.25 | 1.5 |
| 2.0 | 4.5 | 3.0 |
| 3.0 | 6.75 | 4.5 |
| 4.0 | 9.0 | 6.0 |
| 5.0 | 11.25 | 7.5 |
| 6.0 | 13.5 | 9.0 |
| 7.0 | 15.75 | 10.5 |
| 8.0 | 18.0 | 12.0 |
| 10.0 | 22.5 | 15.0 |
| 12.0 | 27.0 | 18.0 |
The study utilised a comprehensive dataset comprising three-component waveform recordings from 1714 local earthquakes that occurred between 2010 and 2019 within and around the GFZ, CBFZ and AFZ. The data were recorded by 12 broad-band seismic stations (BALB, EDC, EZN, KCTX, KRBG, LAP, BOZC, DKL, GADA, GELI, ENEZ, and ERIK) operated by the KOERI. The precise geographical coordinates and elevations of these stations are given in Table 2.
The dataset was partitioned according to the specific fault zone;
Ayvac\(\boldsymbol{\mathrm{\imath}}\)k Fault Zone (AFZ): The analysis incorporated 1098 waveforms from 366 earthquakes (ML 3.0–5.4) that occurred between 2016 and 2017. The depth distribution of these events is predominantly shallow, with 71% located in the 1–10 km range and 29% at 10–20 km depth.
Çan-Biga Fault Zone (CBFZ): This subset consists of 1089 waveforms from 363 earthquakes (ML 2.5–4.5) recorded between 2010 and 2019. Similarly, most events (72%) were nucleated at depths of 1–10 km, with the remainder (28%) at 10–20 km.
Ganos Fault Zone (GFZ): For the northern strand, 2955 waveforms from a total of 985 earthquakes (ML 2.2–5.1) from the 2010–2019 period were processed. The depth distribution for this zone is more evenly spread, with 56% of events at 1–10 km and 44% at 10–20 km depth.
The spatial distribution of events and stations for each fault zone is illustrated in Figure 1b. To ensure optimal path coverage of seismic phases and high data quality for the attenuation analysis, station selection was tailored for each fault zone: events in the GFZ were analysed using records from the GADA, ENEZ, ERIK, LAP, and GELI stations For CBFZ , KRBG, EDC, KCTX, BALB, and LAP stations were used and finally The AFZ dataset was processed using recordings from the BOZC, EZN, DKL, and GADA stations.
| Station Code | Latitude (\(\mathrm{^\circ}\)N) | Longitude (\(\mathrm{^\circ}\)E) | Elevation (m) |
|---|---|---|---|
| BALB | 39.6507 | 27.8642 | 266 |
| EDC | 40.3465 | 27.8618 | 257 |
| EZN | 39.8255 | 26.3247 | 48 |
| KCTX | 40.2627 | 28.3353 | 445 |
| KRBG | 40.3932 | 27.2977 | 79 |
| LAP | 40.3703 | 26.7593 | 230 |
| BOZC | 39.8417 | 26.0528 | 202 |
| DKL | 39.0713 | 26.9053 | 35 |
| GADA | 40.1908 | 25.8987 | 59 |
| GELI | 40.3980 | 26.4742 | 126 |
| ENEZ | 40.7362 | 26.1530 | 100 |
| ERIK | 40.6708 | 26.5132 | 38 |
As a result of the study, the attenuation functions Qp(f) and Qs(f) and the average Qs/Qp ratios were obtained for each fault zone. Quality factors were determined at ten central frequencies in the range of 1.5–18 Hz for the Ganos Fault Zone (GFZ), Çan-Biga Fault Zone (CBFZ), and Ayvac\(\mathrm{\imath}\)k Fault Zone (AFZ), and the results are shown graphically in Figures 4–6. Figure 7 also shows the variation of Qs/Qp ratios with frequency for each of the three zones. The fact that the three active fault zones (GFZ, CBFZ, AFZ) in the Biga Peninsula produce significantly different Q values from each other reveals the effect of the unique geological features of each region on attenuation.
The quality factor power-law equations obtained for the GFZ are Qp(f) = 12.2f\(^{1.15}\) and Qs(f) = 20.7f\(^{1.24}\). The average Qs/Qp ratio in this region is calculated to be approximately 2.1. The GFZ has an active strike-slip character representing the northern branch of the North Anatolian Fault Zone and passes through the thick Neogene sedimentary deposits of the Thrace Basin. The lithological structure of this basin (thick deposits containing sandstone, shale, marl, etc.) and tectonic heterogeneity cause seismic waves in the GFZ region to frequently travel through different interfaces, losing some of their seismic energy through attenuation and scattering. Indeed, the low \(Q_0\) values and high Qs/Qp ratio (\(\mathrm{\sim}\)2.1) calculated for the GFZ indicate a heterogeneous, fluid-containing sedimentary environment. This result is consistent with values reported in previous studies across the Marmara Region with the power-law function (Qs(f)=50f\(^{1.09}\)) determined by Horasan et al. [20]. Additionally, GFZ is an active fault zone that caused the 1912 Mürefte-Şarköy earthquake and is still exposed to intense seismicity today; this explains why the ongoing tectonic deformation in the region keeps the fragmented structure of the crust and fluid circulation alive, thus the attenuation parameters are at low levels. Figure 4 shows the Qp and Qs values calculated at each center frequency and the regression curves representing these values.
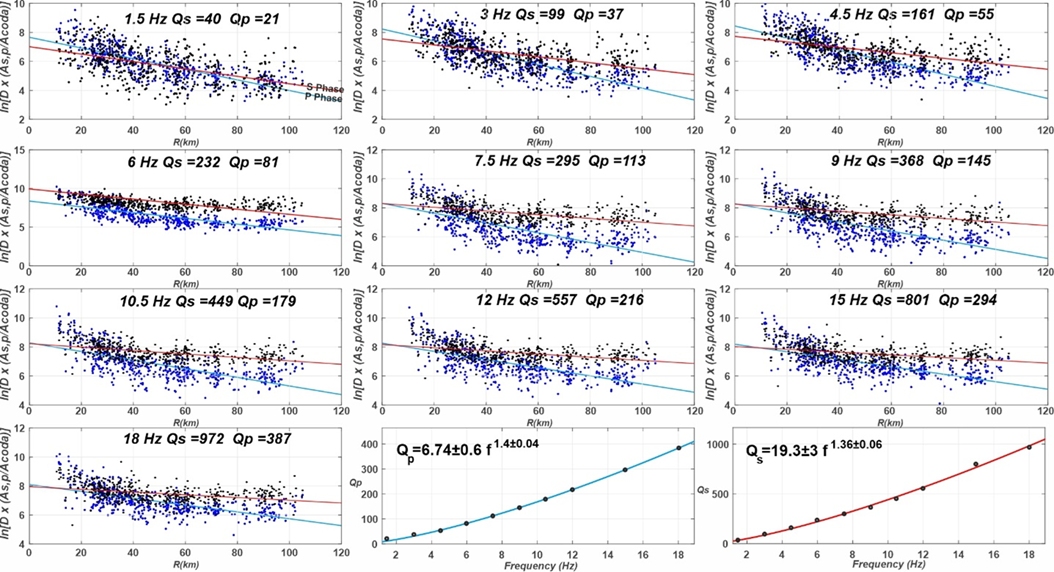
The CBFZ is a NE-SW strike-slip fault zone, a continuation of the Yenice-Gönen-Çan segments on the southern branch of the North Anatolian Fault Zone. This region comprises a geological mosaic consisting of metamorphic core complexes and ophiolitic melanges, overlain by Eocene-Oligocene volcanic and Neogene sedimentary units. Paleozoic-Mesozoic marbles, gneisses, and schists crop out along the fault planes of the CBFZ, and ophiolitic melange slices are occasionally observed. Such fractured and blocky lithological compositions significantly increase the attenuation capability of seismic waves. The lowest P-wave quality factors in the study area were observed in the CBFZ. The very low quality factor (Qp\(\mathrm{\approx}\)6.7) at 1 Hz indicates that P-waves, in particular, undergo strong attenuation in this region. For this fault zone, Qp(f) = 6.7f\(^{1.40}\) and Qs(f) = 19.3f\(^{1.36}\) were calculated (Figure 5), with the average Qs/Qp ratio reaching its highest value of \(\mathrm{\sim}\)2.6. This value can be explained by the density of geothermal resources transported to the surface through fractures in the crust. In conclusion, the geological structure and fault character of the CBFZ are consistent with the observed high attenuation ratios. These findings indicate that this fault zone, which caused large earthquakes such as the 1953 Yenice-Gönen earthquake (Mw=7.2), exhibits both strong scattering and fluid-induced intrinsic attenuation processes along many of its lower segments.
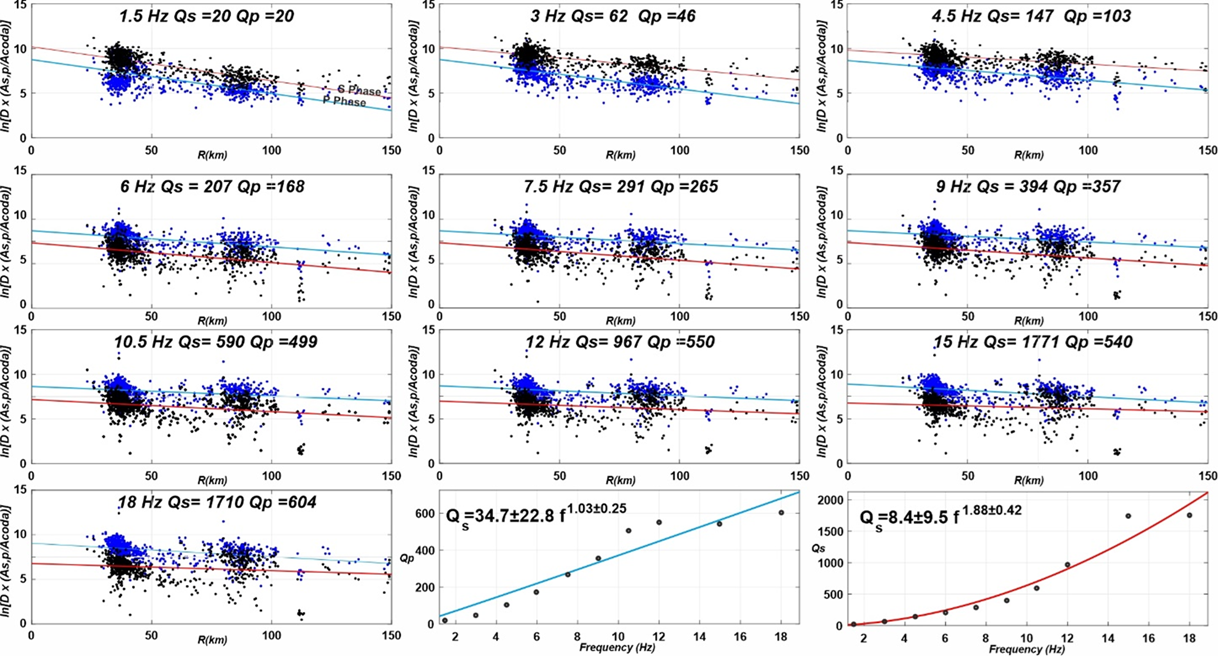
The AFZ, part of the extensional regime in Western Anatolia with its normal faulting structure in the southwest of the Biga Peninsula, differs significantly from the other two regions in terms of attenuation parameters. The P-waves in the AFZ, especially at 1 Hz, have a very high \(Q_0\) value (\(\mathrm{\sim}\)34.7), exhibiting a relatively weaker damping characteristic than the S-phase (\(\mathrm{\sim}\)8.4). The functions obtained for the AFZ are Qp(f) = 34.7f\(^{1.33}\) and Qs(f) = 8.4f\(^{1.15}\) (Figure 6), and the average Qs/Qp ratio is \(\mathrm{\sim}\)1.6, the lowest value obtained in the study area. The high Qp and low Qs values obtained for the AFZ in our study also confirm that S-waves are significantly attenuated in such an environment, where high heat flux and fluid content coexist. This finding suggests that the AFZ, a geothermal-volcanic normal fault environment, is dominated by intrinsic (heat and fluid-induced) attenuation in seismic wave radiation characterization. Along the AFZ, where young volcanic units (e.g., Lower-Middle Miocene basalts and rhyolites) and hydrothermal alteration zones are prevalent, rocks are expected to be partially saturated, fractured, and hot. Long-term aftershocks and surface ruptures observed during the 2017 Ayvac\(\mathrm{\imath}\)k earthquake sequence in the AFZ revealed that the crust is relatively weak and fluid-fed. Indeed, it is known in the literature that S-wave attenuation increases dramatically in regions with high heat flux and partial melting (e.g., very low \(Q_0\) values, such as Qs (f)=18.8f\(^{1.7}\), and high frequency dependence (n) values have been reported in the volcanic region of the Italian Apennines [14]. Our AFZ results also support this general observation, revealing that temperature and fluid presence beneath the crust affect attenuation parameters at least as much as fault type.
In general, the quality factors exhibit a strong frequency dependence in all three fault zones. The frequency dependence value is n\(\mathrm{>}\)1 in all regions. In other words, Q values increase with frequency. This indicates that low-frequency seismic waves are attenuated more by heterogeneous structures and damping mechanisms within the crust. Qs/Qp values are found to be above 2 in the GFZ and CBFZ, while they are around \(\mathrm{\sim}\)1.6 in the AFZ. These ratios indicate that the factors affecting seismic wave attenuation (e.g., lithology, fractured structure and fluid presence, and geothermal sources) are effective in different combinations in each region. Indeed, the dominance of scattering and attenuation mechanisms in heterogeneous geological environments affects the degree of attenuation of P and S waves differently.
The frequency-dependent Qp and Qs functions resulting from the study, when compared with regional and international results obtained with similar methods, generally exhibit a consistency specific to the tectonic setting. For example, in a study conducted on the eastern part of the North Anatolian Fault (NAFZ) by Demirci [16], Qp=22.3f\(^{1.2}\) and Qs=42.6f\(^{1.2}\) were found, and an average Qs/Qp \(\mathrm{\approx}\) 2.02 was reported. These values are in good agreement with the functions we obtained for the GFZ (both strike-slip NAF segments, with n=1.2 and Qs/Qp=2). In contrast, the same study on the East Anatolian Fault (EAFZ) obtained lower frequency dependence (Qs) with n\(\mathrm{\sim}\)0.8 and Qs/Qp \(\mathrm{\approx}\) 1.9. EAFZ is a region with higher heat flux due to the effect of the surrounding young volcanism; therefore, while the sensitivity of S-wave attenuation to frequency decreases (n\(\mathrm{<}\)1), the share of intrinsic absorption increases and the Qs/Qp ratio remains lower than the NAFZ with \(\mathrm{\sim}\)1.9. When we look at the extensional areas in Western Anatolia, Demirci and Bekler [17] found Qp(f)=32.9f\(^{0.5}\), Qs(f)=79.2f\(^{0.9}\) and Qs/Qp \(\mathrm{\approx}\) 1.75 for the Büyük Menderes Graben. It is observed that the Büyük Menderes Graben, as a extension system, exhibits low Qs/Qp character similar to the AFZ. Another comparison can be made from the regions within the Marmara Sea, [20] reported a mean value of Qs(f)=40f\(^{1.03}\) for the Marmara Sea, which is close to the GFZ and CBFZ regions but shows a slightly higher \(Q_0\) and lower frequency dependence. On the other hand, Ak\(\mathrm{\imath}\)nc\(\mathrm{\imath}\) et al. [31] found an unusually high \(Q_0\) and low n for the crust beneath the Sea of Marmara, Qs=180f\(^{0.45}\). These different results suggest that attenuation properties can vary across subregions even within the Marmara region and reflect local effects of the geological structure and heat-flow regime.
A consistent picture is observed when the results are compared on worldwide scale. For example, in the Kinnaur region of the Himalaya, Kumar et al. [5] reported values for Qp(f)=47f\(^{1.04}\), Qs(f)=86f\(^{0.96}\), and Qs/Qp in the range of \(\mathrm{\sim}\)1.5–1.9, relating these ratios to the liquid saturation in the crust. Our Qs/Qp ratio of \(\mathrm{\sim}\)1.6 obtained in the AFZ can also be interpreted as an indicator of high fluid content and is quite close to the value band in the Himalayas. In the Kanto region (Japan), Yoshimoto et al. [7] found Qp(f)\(\mathrm{\approx}\)32f\(^{0.95}\) and Qs(f)\(\mathrm{\approx}\)83f\(^{0.73}\). A relatively low frequency exponent (n) for the S-wave (0.73) is observed in the Kanto region, suggesting the relative importance of intrinsic attenuation in the crust. In studied regions (especially GFZ and CBFZ), n values are higher (\(\mathrm{\sim}\)1.2–1.4), indicating that scattering effects may be stronger. In the intraplate region of Bhuj (India), Padhy [32] determined Qp(f)=19f\(^{1.10}\), Qs(f)=50f\(^{1.02}\). When the \(Q_0\) and n values of the Bhuj region are examined, it is seen that it has low \(Qp_0\) (19) and high Qs/Qp ratio (\(\mathrm{>}\)2.5), similar to the CBFZ; This confirms that both regions exhibit low Q\(_{0}\) and high Qs/Qp ratios, which are characteristic of intraplate fault zones. In studies conducted for volcanic areas, generally very low \(Q_0\) and high n values are reported. For example, in the Sonora volcanic region of Mexico, Castro et al. [15] found extremely low Qs\(_{0}\) of Qp(f)=5f\(^{1.1}\) and Qs(f)=15f\(^{1.1}\), while in the volcanic region of the Italian Apennines, values of Qs(f)=18.8f\(^{1.7}\) were obtained. These extreme values indicate that low-frequency waves are almost completely attenuated in volcanic environments (\(Qs_0\) \(\mathrm{\sim}\) 18.8) and that both scattering and intrinsic components of attenuation are very strong. Our results obtained on AFZ, although not to such extreme values, are qualitatively consistent with the literature, which shows how strongly volcanic-geothermal regions can attenuate S-waves.
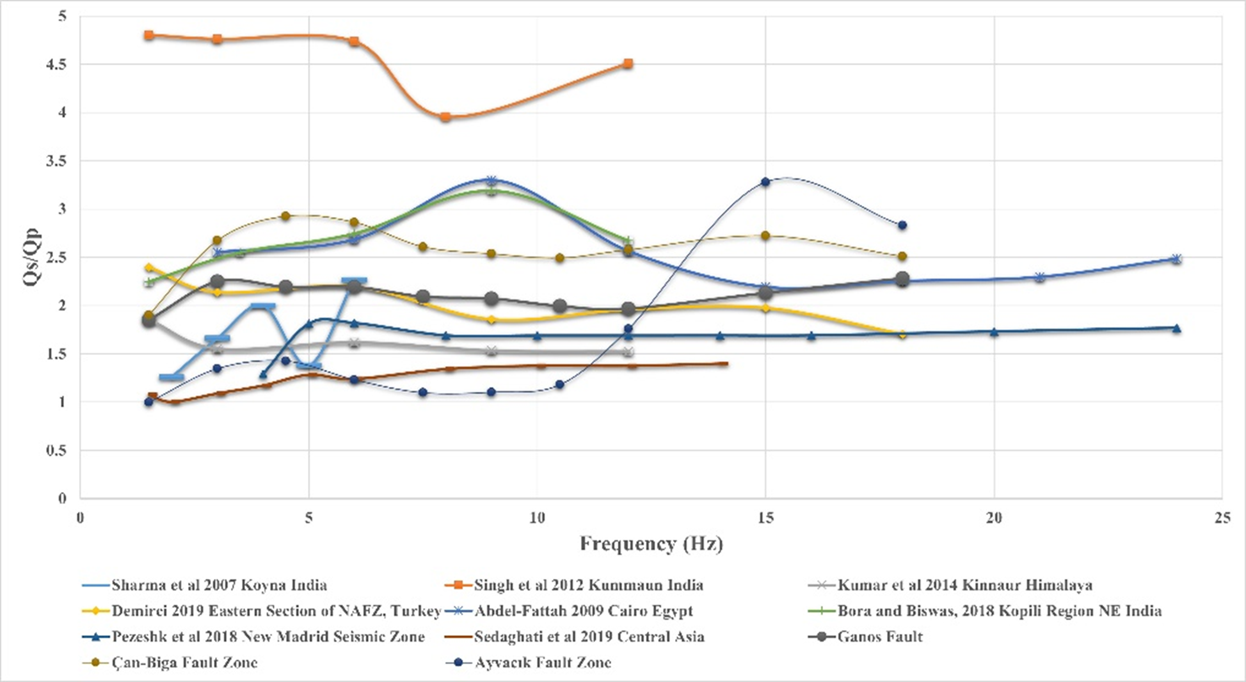
Studies focusing on the Qs/Qp ratio provide critical insights into the physical characteristics of the crust during seismic wave propagation. In this context, the results obtained in this study are consistent with values reported at the global scale. Numerous studies conducted in different regions indicate that S waves are generally less attenuated than P waves, resulting in Qs/Qp ratios predominantly greater than 1 (Figure 7). For instance, ratios exceeding 1 in the Kanto Basin, Japan, point out the role of crustal heterogeneity and scattering. Similarly, studies by Zaretan et al. [33] on Qeshm Island, Iran, as well as Sharma et al. [9] and Singh et al. [34] in India, emphasize the influence of fluids and multiple fracture systems, further supporting this observation and the finding that S waves exhibit higher quality factors (Table 3) In the Marmara Region, Horasan and Boztepe_Güney [20] reported Qs/Qp ratios approaching 2 in certain subregions, reflecting intense scattering processes associated with active tectonics. In this study, the Qs/Qp ratios for the Biga Peninsula were estimated as \(\mathrm{\sim}\)1.63 for the Ayvac\(\mathrm{\imath}\)k Fault Zone, \(\mathrm{\sim}\)2.10 for the Ganos Fault Zone, and \(\mathrm{\sim}\)2.58 for the Çan–Biga Fault Zone, indicating the strong influence of contrasting tectonic regimes (strike-slip versus pull-apart) and geological conditions on seismic attenuation. The comparative plot in Figure 7 illustrates the frequency-dependent variation of these ratios and their relationship with results from different geological environments. Figure 7 also includes Qs/Qp ratios reported in previous studies from different tectonic environments (e.g., Abdel-Fattah, 2009 [35]; Bora and Biswas, [36]; Pezeshk et al. [37]; Sedaghati et al.[38]).The Biga Peninsula data exhibit characteristics comparable to those observed in fractured and sedimentary settings, marked by relatively high Qs/Qp values, while also showing similarities with trends reported from geothermal and volcanic regions at specific frequency ranges. These observations confirm that the Qs/Qp ratio not only reflects differences in seismic wave propagation but also provides reliable information on fracture density, fluid content, thermal conditions, and the current tectonic regime of the crust.
| Reference | Investigation Area | Qp Function | Qs Function | Qs/Qp | Frequency Range(Hz) |
|---|---|---|---|---|---|
| Kumar et al. [5] | Kinnaur, Himalayas | Q\(_{p}\)=(47\(\mathrm{\pm}\)2)f\(^{(1.04\pm 0.04)}\) | Q\(_{s}\)=(86\(\mathrm{\pm}\)4)f\(^{(0.96\pm 0.03)}\) | 1.5-1.9 | 1.5-12 Hz |
| Yoshimoto et al. [7] | Kanto, Japan | Q\(_{p}\)=(32.25)f\(^{(0.95)}\) | Q\(_{s}\)=(83.33)f\(^{(0.73)}\) | \(\mathrm{>}\)1 | 1.5-24 Hz |
| Ma’hood et al. [10] | East Iran | Q\(_{p}\)=(40\(\mathrm{\pm}\)4.8)f\(^{(0.99\pm 0.04)}\) | Q\(_{s}\)=(52.6\(\mathrm{\pm}\)5.5)f\(^{(1.02\pm 0.06)}\) | – | 1.5-24 Hz |
| Mukhopadhyay et al. [13] | Aswan Reservoir, Egypt | – | Q\(_{s}\)=(34.2\(\mathrm{\pm}\).9)f\(^{(1.23\pm 0.107)}\) | – | 1.5-12 Hz |
| Castro et al. [14] | The Apennines, Italy | – | Q\(_{s}\)=(18.8)f\(^{(1_7)}\) | – | 1-25 Hz |
| Castro et al. [15] | Sonora, Mexico | Q\(_{p}\)=(5)f\(^{(1_1)}\) | Q\(_{p}\)=(15)f\(^{(1_1)}\) | – | 0.4-63 Hz |
| Demirci [16] | North Anatolian Fault, Türkiye | (22.3 \(\mathrm{\pm}\) 2.3)f\(^{1.2\ \pm \ 0.1}\) | (42.6 \(\mathrm{\pm}\) 7.5)f\(^{1.2\ \pm \ 0.1}\) | 2.02 | 1.5-18 Hz |
| Demirci [16] | East Anatolian Fault, Türkiye | (25.3 \(\mathrm{\pm}\) 9.5)f\(^{1.0\ \pm \ 0.1}\) | (61.6 \(\mathrm{\pm}\) 10)f\(^{0.8\ \pm \ 0.1}\) | 1.9 | 1.5-18 Hz |
| Demirci and Bekler [17] | Büyük Menderes Graben, Türkiye | (32.9 \(\mathrm{\pm}\) 13.7)f\(^{0.5\ \pm \ 0.16}\) | (79.2 \(\mathrm{\pm}\) 14.6)f\(^{0.9\ \pm \ 0.07}\) | 1.75 | 1.5 -18 Hz |
| Demirci et al. [18] | SW Anatolia, Türkiye | (22\(\mathrm{\pm}\) 5)f\(^{1.47\ \pm \ 0.1}\) | (39. 6 \(\mathrm{\pm}\) 5)f\(^{1.26\pm 0.05}\) | – | 1.5-18 Hz |
| Ak\(\mathrm{\imath}\)nc\(\mathrm{\imath}\) and Eyidogan [19] | Erzincan, Türkiye | – | (35)f\(^{0.83}\) | – | 1.5-24 Hz |
| Horasan and Boztepe-Guney [20] | Marmara Region, Türkiye | – | (50\(\mathrm{\pm}\) 1.7)f\(^{1.09\ \pm \ 0.05}\) | – | 1.5-24 Hz |
| Horasan and Boztepe-Guney [20] | Marmara Sea, Türkiye | – | (40 \(\mathrm{\pm}\) 5)f\(^{1.03\ \pm \ 0.06}\) | – | 0.4-15 Hz |
| Ak\(\mathrm{\imath}\)nc\(\mathrm{\imath}\) et al. [31] | Marmara Sea, Türkiye | – | (180)f\(^{0.45}\) | – | 0.4-15 Hz |
| Padhy [32] | Bhuj, India | Q\(_{p}\)=(19.23\(\mathrm{\pm}\)7.02)f\(^{(1.1\pm 0.06)}\) | Q\(_{s}\)=(50\(\mathrm{\pm}\)25)f\(^{(1.02\pm 0.04)}\) | \(\mathrm{>}\)1 | 1-24 Hz |
| Zarean et al. [33] | Queshm Island, İran | Q\(_{p}\)=(10)f\(^{(0.83)}\) | Q\(_{s}\)=(16.66)f\(^{(0.97)}\) | \(\mathrm{>}\)1 | 1.5-36 Hz |
| This Study | Ayvac\(\mathrm{\imath}\)k Fault Zone | (34.7 \(\mathrm{\pm}\) 22.8)f\(^{1.33\pm 0.25}\) | (8.4 \(\mathrm{\pm}\) 9.5)f\(^{1.15\ \pm \ 0.04}\) | 1.63 | 1.5-18 Hz |
| This Study | Ganos Fault Zone | (12.2 \(\mathrm{\pm}\) 1.2)f\(^{1.15\ \pm \ 0.04}\) | (20.7 \(\mathrm{\pm}\) 3.4)f\(^{1.24\ \pm \ 0.06}\) | 2.10 | 1.5-18 Hz |
| This Study | Çan-Biga Fault Zone | (6.74 \(\mathrm{\pm}\) 0.6)f\(^{1.4\ \pm \ 0.04}\) | (19.3 \(\mathrm{\pm}\) 3)f\(^{1.36\ \pm \ 0.06}\) | 2.57 | 1.5-18 Hz |
This study reveals the frequency-dependent damping properties for three main fault zones (GFZ, CBFZ, AFZ) in the Biga Peninsula using a large dataset of 1714 earthquakes recorded between 2010 and 2019. Being based on this comprehensive database increases the reliability of the results and makes the study the first detailed body wave attenuation study conducted for the region. The quality factor functions obtained are
Qp(f) = 12.2f\(^{1.15}\), Qs(f) = 20.7f\(^{1.24\ }\)(Qs/Qp \(\mathrm{\approx}\) 2.10) for GFZ;
Qp(f) = 6.7f\(^{1.40}\), Qs(f) = 19.3f\(^{1.36}\) (Qs/Qp \(\mathrm{\approx}\) 2.58) for CBFZ;
Qp(f) = 34.7f\(^{1.33}\), Qs(f) = 8.4f\(^{1.15}\) (Qs/Qp \(\mathrm{\approx}\) 1.63) For the AFZ
These findings clearly demonstrate the role of fault type (strike-slip vs. normal fault), lithology, heterogeneity, and fluid content in determining the damping behavior. Furthermore, the derived Qp(f) and Qs(f) relationships provide critical input functions for future regional seismological researches. These results can be directly used in studies such as the determination of ground motion prediction equations, derivation of spectral source parameters and the calculation of earthquake source parameters, enhancing the reliability of regional earthquake hazard assessments. In conclusion, this study not only contributes to a better understanding of the seismotectonic characteristics of the Biga Peninsula, but also provides important input for future engineering seismology and earthquake risk mitigation studies in the region.
The authors would like to express their gratitude for the helpful comments provided by the anonymous reviewers and the editor, which significantly improved the quality of this manuscript. Some figures were created with the Generic Mapping Tools of Wessel and Smith [].